RANDOM SUBSPACE LEARNING WITH DATA DRIVEN WEIGHTING SCHEMES

INTRODUCTION
An appropriate mix of good core learners leads to a reduction in prediction error and improves the precision of a regression or a classification task. This technique is known as ensemble learning (aggregation). One of the ensemble learning methods is Random Adaptive Subspace Learning (RASSEL). What is the importance of RASSEL, and how does it work?

IMPORTANCE OF RASSEL
Usually, it is hard for a traditional algorithm to build a regression model, or to classify the dataset when it possesses a very small instances to features ratio (n«p). The prediction problem becomes even more difficult when this huge number of features are highly correlated. To solve this problem, RASSEL guides the selection of good candidate features from the dataset. It selects the best base learners and ultimately the model produces the lowest possible prediction error.
WEIGHTING SCHEMES
Uniform scheme ?
In most typical random subspace learning algorithms, the features are selected according to an equally likely scheme. One may therefore wonder if it is possible to choose the candidate features for with some predictive benefits.
Data-driven weighting schemes !
The proposed method of data-driven weighting schemes that I’m going to present, explores a variety of weighting schemes for choosing the features, based on the statistical measures of relationship between the response variable and each explanatory variable.
How does RASSEL work ?
Like random forest and all other random subspace learning methods, RASSEL consists of building an ensemble of $L$ base learners noted here:
and forming the ensemble prediction function as:
PREDICTION TASK
For classification
In classification, we predict the class membership of
,
by using the ensemble predicting estimator:
For regression
Given
,
we predict its corresponding response using:
RASSEL Algorithm

One of the most crucial ingredients in the above proposed algorithm is the dimension q of the subspace, because its value has a strong bearing on an important aspect of the correlation among the base learners. The book $Random Forests, Machine Learning, L. Breiman, 45 (2001), 532. recommends reasonable values;
If p«n
For classification, and for regression,
If p»n
For classification, and for regression,
Variance of the ensemble prediction function
DATA-DRIVEN WEIGHTING SCHEME
In regression
The proposed weighting scheme proposed in the RASSEL algorithm is generated by calculating the correlation between each predictor
and the response variable y.
In classification
We consider using the corresponding F statistic
EXTRACTING IMPORTANT FEATURES
Algorithm for regression

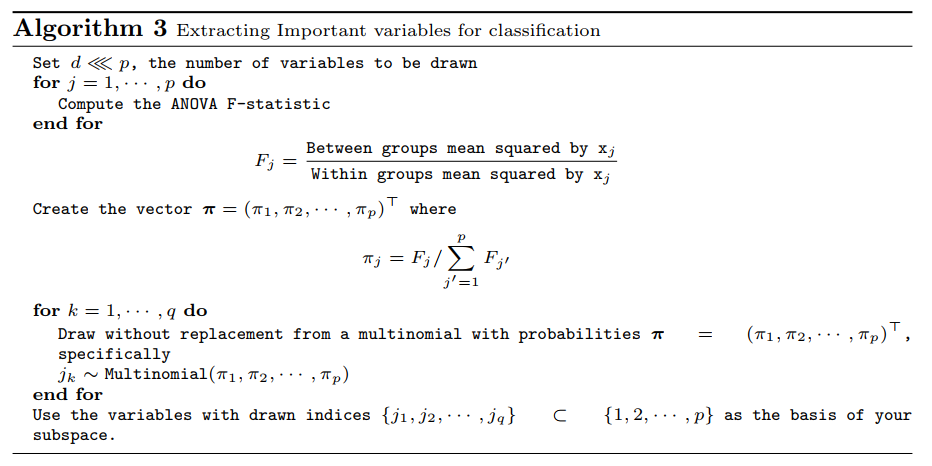
Algorithm for classification
IMPLEMENTATION
“Algorithm 2” in Python
def EIV_regression(df, ypos):
    n, p = df.shape[0], df.shape[1]-1
    # Computing q
    if df.shape[0] >= df.shape[1]:
        q = int(math.floor(p/3))
    else:
        q = int(np.min([math.floor(n/5), math.floor(p/3)]))
    # Generating the weighting schemes
    r = []
    for j in range(p+1):
        if j != ypos-1:
            corr, _ = pearsonr(df.iloc[:,ypos-1], df.iloc[:,j])
            r.append(corr)
    vect_pi = [(i**2)/(la.norm(r)**2) for i in r]
    # Drawing q features
    basis = []
    for i in range(q):
        basis.append(np.random.choice(p, 1, replace=False, p=vect_pi))
    return basis, vect_pi
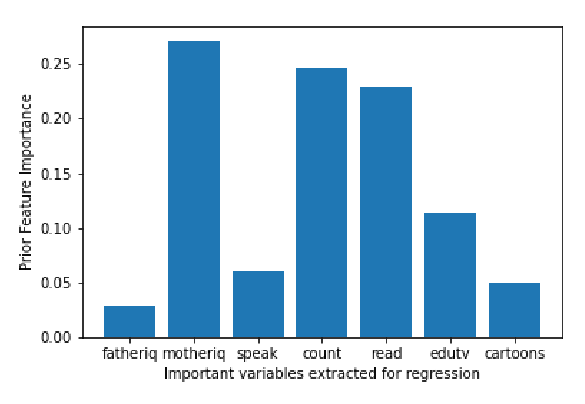
A representative simulation results for regression analysis on real dataset: “gifted.csv”.
df1 = pd.read_csv("gifted.csv")
plt.xlabel("Important variables extracted for regression")
plt.ylabel("Prior Feature Importance")

impR = EIV_regression(df1, 1)
plt.bar(range(1,df1.shape[1]), impR[1]);
label=["fatheriq","motheriq","speak","count","read","edutv","cartoons"]
plt.xticks(range(1,df1.shape[1]),label)
“Algorithm 3” in Python
Extracting Important variables for classification
def EIV_classification(df, ypos):
    n, p = df.shape[0], df.shape[1]-1
    # Computing q
    if df.shape[0] >= df.shape[1]:
        q = int(math.floor(np.sqrt(p)))
    else:
        q = int(np.min([math.floor(n/5), math.floor(np.sqrt(p))]))
    # Generating the weighting schemes
    F = []
    for j in range(p+1):
        if j != ypos-1:
            y = df.iloc[:,ypos-1].values
            x = df.iloc[:,j].values
            grps = pd.unique(y)
            d_data = {grp:x[y == grp] for grp in grps}
            f, pval = stats.f_oneway(list(d_data.values())[0],list(d_data.values())[1])
            F.append(f)
    vect_pi = [(i)/(np.sum(F)) for i in F]
    # Drawing q features
    basis = []
    for i in range(q):
        basis.append(np.random.choice(p, 1, replace=False, p=vect_pi))
    return basis, vect_pi
A representative simulation results for classification analysis on real dataset: “prostate-cancer-1.csv”.
df = pd.read_csv("prostate-cancer-1.csv")
plt.xlabel("Important variables extracted for classification")
plt.ylabel("Prior Feature Importance")

imp = EIV_classification(df, 1)
plt.bar(range(1,df.shape[1]), imp[1]);

COMPUTATIONAL DEMONSTRATION

CONCLUSION
RASSEL algorithm outperforms many classifier ensembles. It reaches the highest accuracy when the number of features is large, as well as the number of instances. In addition, it performs good when there are redundant features on the dataset, but it has limitations ! For instance, it can not deal with dataset that has categorical features: these features should be encoded numerically. Also, the algorithm fails to select the optimal feature subsets, when the number of features is very small. To improve RASSEL, we can generalize it in such a way that all base learners can be adapted easily